Webpages about Smoldyn and spatial simulation
- Brief description of Smoldyn
- Spatial simulation and simulators
- Questions and answers about Smoldyn
- Advice on choosing simulation parameters
- Research project ideas
- Algorithm details
Page contents
Overview
Smoldyn is a particle-based spatial stochastic simulator. Molecules are represented by point-like particles in 1-, 2-, or 3-dimensional continuous space. Molecules diffuse by Brownian motion, react when they collide into each other, and interact with surfaces (e.g. membranes) in a variety of realistic ways. Smoldyn is typically used for biophysics research or cell modeling research. Examples include:
Biophysics:
- diffusion and reaction rates within spatially crowded compartments
- biochemical signal processing, such as for signal amplification
- transcription factor diffusion to DNA binding sites
Cell modeling:
- cell signaling within bacteria, single-cell eukaryotes, or neurons
- bacterial cell division
- quantification of FRAP or other microscopy experimental results
To run a Smoldyn simulation, you need to describe your model in a plain-text configuration file. This file describes the system surfaces, molecular species, diffusion coefficients, and chemical reactions. It also lists parameters for the graphical display and any quantitative output. Smoldyn reads this file, sets up simulation parameters, and runs the simulation. During the simulation, Smoldyn displays the system to a graphics window and saves quantitative data to text files. Many simulation parameters, such as time step sizes, can be changed mid-simulation.
Example
A simple simulation example derives from the classic Lotka-Volterra predator-prey model. In their model, the number of prey increase through reproduction and decrease through predation, while the number of predators increase through predation and decrease with a fixed death rate. This scheme can be written with chemical reaction notation, now using A for a prey "molecule" and B for a predator "molecule":
A --> 2 A
A + B --> 2 B
B --> nothing
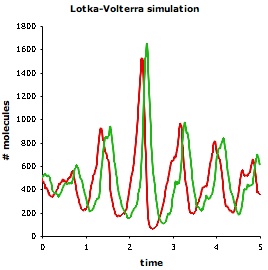
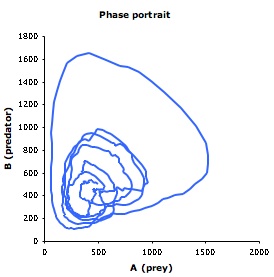
Lotka and Volterra showed that this model, without spatial detail, leads to sustained regular population oscillations. Smoldyn simulations, which include spatial detail, produce different results. As shown below, even if the system starts well-mixed, it rapidly develops spatial organization; also, the population oscillations are irregular and have highly variable amplitudes. The Smoldyn configuration file is here.
 |
 |
|
| Smoldyn graphical output for the Lotka-Volterra simulation. Red dots represent prey and green are predators. The system starts well-mixed but develops spatial structure. | Populations of predators (green) and prey (red) over time. These oscillations vary much more, both in amplitude and in timing, than they do in non-spatial simulations. | Phase diagram for predator (y-axis) and prey (x-axis) populations. The system starts at the metastable equilibrium point near the center of the cycles, and then develops spontaneous counter-clockwise cycles. |
Smoldyn features
Molecular diffusion
- isotropic - simple Brownian motion that obey's Fick's laws
- anisotropic - partially oriented diffusion, which might apply to liquid crystals or within zeolites
- drift - diffusion with net motion, to represent external forces on molecules
- surface - surface-bound molecules (e.g. integral membrane proteins) can diffuse within the surface
Chemical reactions
- zeroth order - adds molecules to the system from unmodeled processes (e.g. protein synthesis)
- unimolecular - dissociation reactions or conversions between molecular conformations
- bimolecular - association or other second order chemical reactions
- surface-specific - reactions can be defined to only occur on a specific surface
- compartment-specific - reactions can be defined to only occur in a specific compartment
- conformational spread - for transmission of protein activity through mechanical interactions
- excluded volume - using the reaction framework, molecules reflect off of each other to simulate excluded volume
Surfaces
- 6 elementary shapes - surfaces can be constructed from rectangles, triangles, spheres, hemispheres, cylinders, or disks, which allows for convenient input
- 4 surface molecule orientations - molecules can bind to the front or back of a surface (e.g. peripheral membrane protein) or can be transmembrane in an "up" or "down" orientation
- adsorption and desorption - molecules adsorb to and desorb from surfaces with quantitatively accurate rates
- partial transmission - surfaces can be partially permeable to specific molecules, with accurate permeability coefficients
- compartments - spatial compartments, which are particularly useful for input and output, can be defined using surfaces
User interface and support
- installation - pre-compiled code available for Macs and Windows. Relatively simple compilation for Unix. Full instructions are included in the user manual
- graphics - displayed while the simulation executes, but can also be turned off for faster simulations
- configuration files - user writes files in plain text using straightforward statements
- documentation - Smoldyn has a thorough user's manual and a detailed programmer's manual.
- support - e-mail support@smoldyn.org with questions
Accuracy
Quantitative accuracy is one of Smoldyn's particular strengths. Although Smoldyn does not simulate all aspects of simulated systems exactly, it comes very close. Moreover, Smoldyn simulates all interaction rates (reaction rates, adsorption rates, etc.) within about 2% of the user-requested rates over all possible rate ranges. Among other things, this means that Smoldyn simulations show correct equilibrium concentrations.
Few biochemical parameters are experimentally known to high accuracy, so one might wonder why accuracy is so important for a biochemical simulator. The answers include:
- the qualitative dynamics of a system can be highly sensitive to individual rate constants
- results from algorithms that are known to be inaccurate are likely to be inconclusive
- accurate simulations can be useful tools for quantifying experimental measurements
- more accurate algorithms allow longer simulation time steps, and thus faster simulations
Our Publications webpage lists the research papers that describe Smoldyn's algorithms and that describe how we made Smoldyn highly accurate. In brief, we accounted for a few aspects of diffusion-influenced reactions that prior authors tended to ignore. We considered (1) the molecular concentration changes that result from either the reaction or the surface interaction of interest, (2) the effects of reversible processes, such as reversible chemical reactions and reversible transmission through surfaces, and (3) the approximations that are made when the actual highly detailed microscopic trajectories of Brownian particles are simulated using straight line displacements.
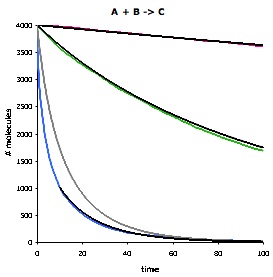 |
This figure compares Smoldyn's simulated bimolecular reaction rates (colored lines) with the mass-action theoretical rates (black and grey lines). It shows the number of 'A' molecules as a function of time for the reaction A + B -> C, using three different rate constants: slow (red), medium (green), and fast (blue). For the slow and medium reaction rates, Smoldyn's results agree essentially perfectly with mass-action theory, where the only difference arises from the stochastic noise that Smoldyn accounts for. For the fast reaction rate, the Smoldyn simulation is much faster than the grey line. This is not an error in Smoldyn, but arises from the fact that mass-action theory is only an approximation, and in fact is incorrect for fast diffusion-limited reactions that are not at steady-state. The nearby black line also represents mass action theory, but starts at a later time, when the system is closer to steady-state, and so agrees well with simulation. |
| The figure on the right shows the concentration of molecules that are adsorbed to a surface as a function of time. The simulation result is shown in blue and the theoretical result is in red. Again, agreement is essentially perfect, with the only differences arising from stochastic noise. The horizontal black line at the top of the figure shows the equilibrium surface concentration, which is the asymptote for the other curves. | 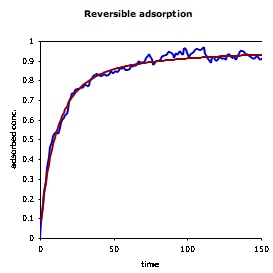 |
Utility programs
Two utility programs are distributed with Smoldyn: wrl2smol and SmolCrowd. These are not as user-friendly as the Smoldyn program, but still may be useful for users.
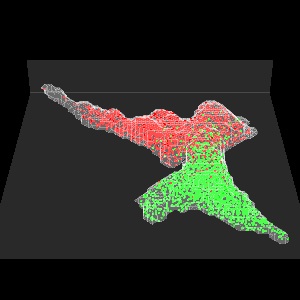
- wrl2smol reads VRML format triangle mesh data, which can be written by most mesh-generation programs, and converts it to Smoldyn format surface data. This allows users to use experimental surface data, such as that shown below, in Smoldyn simulations.
- SmolCrowd creates lists of randomly placed circles or spheres, output in Smoldyn format, for use in crowding simulations. These crowders, which do not overlap each other, can all be the same size, or can be chosen from a power-law size distribution. The crowders can be placed in ways that account for periodic boundaries.
 |
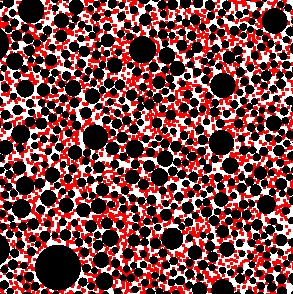 |
| Smoldyn simulation of diffusion within a cell. The wrl2smol utility program converted the surface data from VRML format to Smodyn format. | Smoldyn simulation of diffusion in a 2-dimensional crowded system. The black circles are fixed crowders, which obstruct diffusion, and the red dots are individual molecules. This crowded system was generated with the SmolCrowd utility program. |